
Professional crypto sentiment analysis requires monitoring aggregated fear and greed indices, parsing social media through natural language processing algorithms, and tracking institutional positioning via funding rates on perpetual futures. Smart traders combine sentiment extremes with technical indicators—watching for doji candlesticks during euphoric peaks or hammer patterns amid capitulation phases. Volume analysis confirms whether sentiment shifts carry genuine conviction or represent fleeting noise. The sophisticated approach involves weighting authoritative voices against retail chatter, then adjusting position sizing accordingly when sentiment reaches dangerous extremes that typically precede violent reversals.
Why do rational investors find themselves swept up in the euphoric madness of a bull run, only to capitulate at precisely the worst moment during a market crash?
The answer lies in their failure to systematically read market sentiment—that ineffable yet quantifiable collective psyche that drives cryptocurrency prices far beyond what fundamental analysis might suggest.
Professional sentiment analysis begins with understanding polarity: the binary classification of market emotions into positive (bullish), negative (bearish), or neutral states.
Savvy traders leverage specialized platforms employing natural language processing algorithms and machine learning models—Support Vector Machines and Naive Bayes classifiers, primarily—to parse vast datasets from social media, news outlets, and financial platforms.
These tools transform subjective human emotions into actionable trading intelligence.
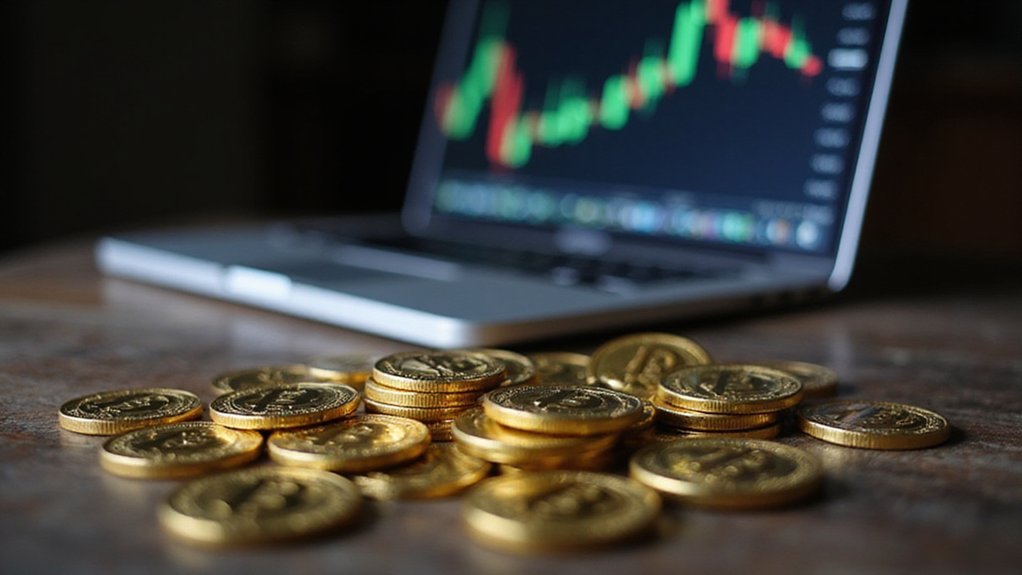
The Crypto Fear and Greed Index serves as perhaps the most accessible sentiment aggregation tool, distilling market psychology into a single numerical value.
When greed peaks (typically above 80), contrarian investors recognize impending corrections; conversely, extreme fear readings below 20 often signal opportunistic entry points.
However, relying solely on aggregated indices without understanding their constituent data sources represents a form of analytical myopia.
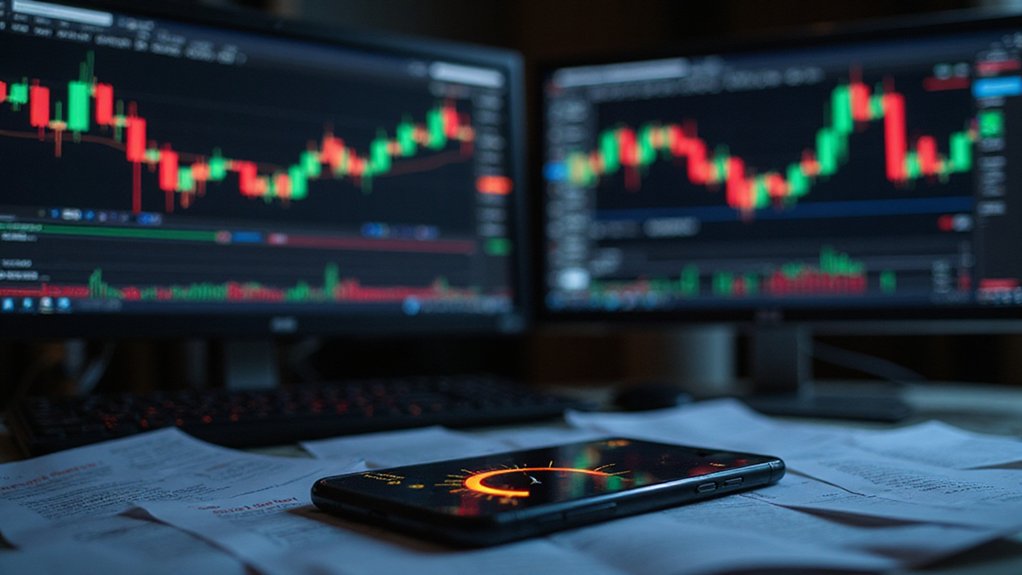
Technical analysis provides vital confirmation of sentiment shifts.
Candlestick patterns reveal underlying market psychology—doji formations during periods of apparent bullishness often betray hidden uncertainty, while hammer patterns amid bearish sentiment suggest potential reversals.
Trading volume amplifies these signals; massive volume accompanying price movements indicates conviction, whereas price action on anemic volume suggests tentative, easily reversible sentiment. Analyzing volume-price relationships can reveal whether sentiment shifts are backed by genuine market conviction or merely temporary fluctuations.
The most sophisticated practitioners monitor influential voices within the cryptocurrency ecosystem, recognizing that certain figures (institutional analysts, prominent developers, regulatory officials) wield disproportionate influence over market sentiment.
Social media sentiment analysis, while democratically extensive, must be weighted against these authoritative sources. Automated trading bots can effectively incorporate this sentiment data alongside technical indicators to execute trades without the emotional biases that plague human decision-making.
Advanced practitioners also monitor funding rates across perpetual futures exchanges, as these periodic payments between long and short traders provide direct insight into market positioning and sentiment intensity.
Implementing sentiment analysis requires strategic integration with risk management protocols.
Sentiment extremes—whether euphoric or despairing—typically precede volatility spikes, necessitating position sizing adjustments and stop-loss modifications.
The irony, of course, is that the most profitable sentiment-based trades feel fundamentally wrong when executed, requiring traders to act against their own psychological inclinations while systematically exploiting others’ emotional vulnerabilities.
Frequently Asked Questions
What’s the Difference Between Market Sentiment and Technical Analysis Indicators?
Market sentiment analyzes investor psychology and collective mood through social media chatter, news flow, and behavioral indicators, while technical analysis examines historical price patterns and mathematical indicators like moving averages or RSI.
One gauges the emotional temperature of traders (often revealing their propensity for irrational exuberance), whereas the other relies on charts and statistical measurements.
Smart traders combine both approaches—sentiment reveals *why* markets move, technical analysis suggests *when* they might.
How Often Should I Check Sentiment Indicators During Volatile Market Periods?
During volatile periods, traders should check sentiment indicators bi-daily for consolidated metrics like the Fear and Greed Index, while monitoring social media sentiment hourly when markets turn particularly unruly.
Daily reviews of derivatives data and trading volumes provide essential context without inducing decision paralysis.
The key lies in avoiding the temptation to obsessively refresh dashboards—a practice that typically transforms rational analysis into emotional reactivity, ironically defeating sentiment monitoring’s primary purpose.
Can Sentiment Analysis Predict Exact Price Movements or Just General Trends?
Sentiment analysis excels at identifying general market trends and directional movements but struggles with precise price predictions—a limitation that apparently surprises those expecting algorithmic crystal balls.
While models can detect bullish or bearish momentum shifts, pinpointing exact entry and exit points remains elusive due to market volatility and sentiment noise.
Smart traders leverage sentiment for broader strategic positioning rather than tactical precision, recognizing that emotions reveal direction, not destinations.
Which Sentiment Indicators Work Best for Small-Cap Versus Large-Cap Cryptocurrencies?
Small-cap cryptocurrencies respond most dramatically to social media sentiment and stablecoin volume indicators, given their susceptibility to retail-driven momentum and thin liquidity.
Large-cap assets, conversely, benefit from sophisticated derivatives analysis and thorough on-chain metrics that reflect institutional positioning.
The irony? Small-caps require simpler indicators precisely because they’re more volatile, while established cryptocurrencies demand complex analytical frameworks—yet both can still move inexplicably on a single tweet.
How Do I Avoid Getting Influenced by My Own Emotions When Reading Sentiment?
Traders combat emotional interference through systematic detachment protocols: maintaining detailed trading journals that expose psychological patterns, establishing predefined entry-exit rules before market exposure, and employing cooling-off periods during high-volatility events.
The most effective practitioners cross-reference multiple sentiment sources rather than cherry-picking confirmatory data, while implementing mechanical stop-losses that eliminate discretionary panic selling.
Regular self-assessment sessions—reviewing past decisions through objective lenses—gradually builds emotional resilience against market hysteria.